Basic Statistics |
Up |
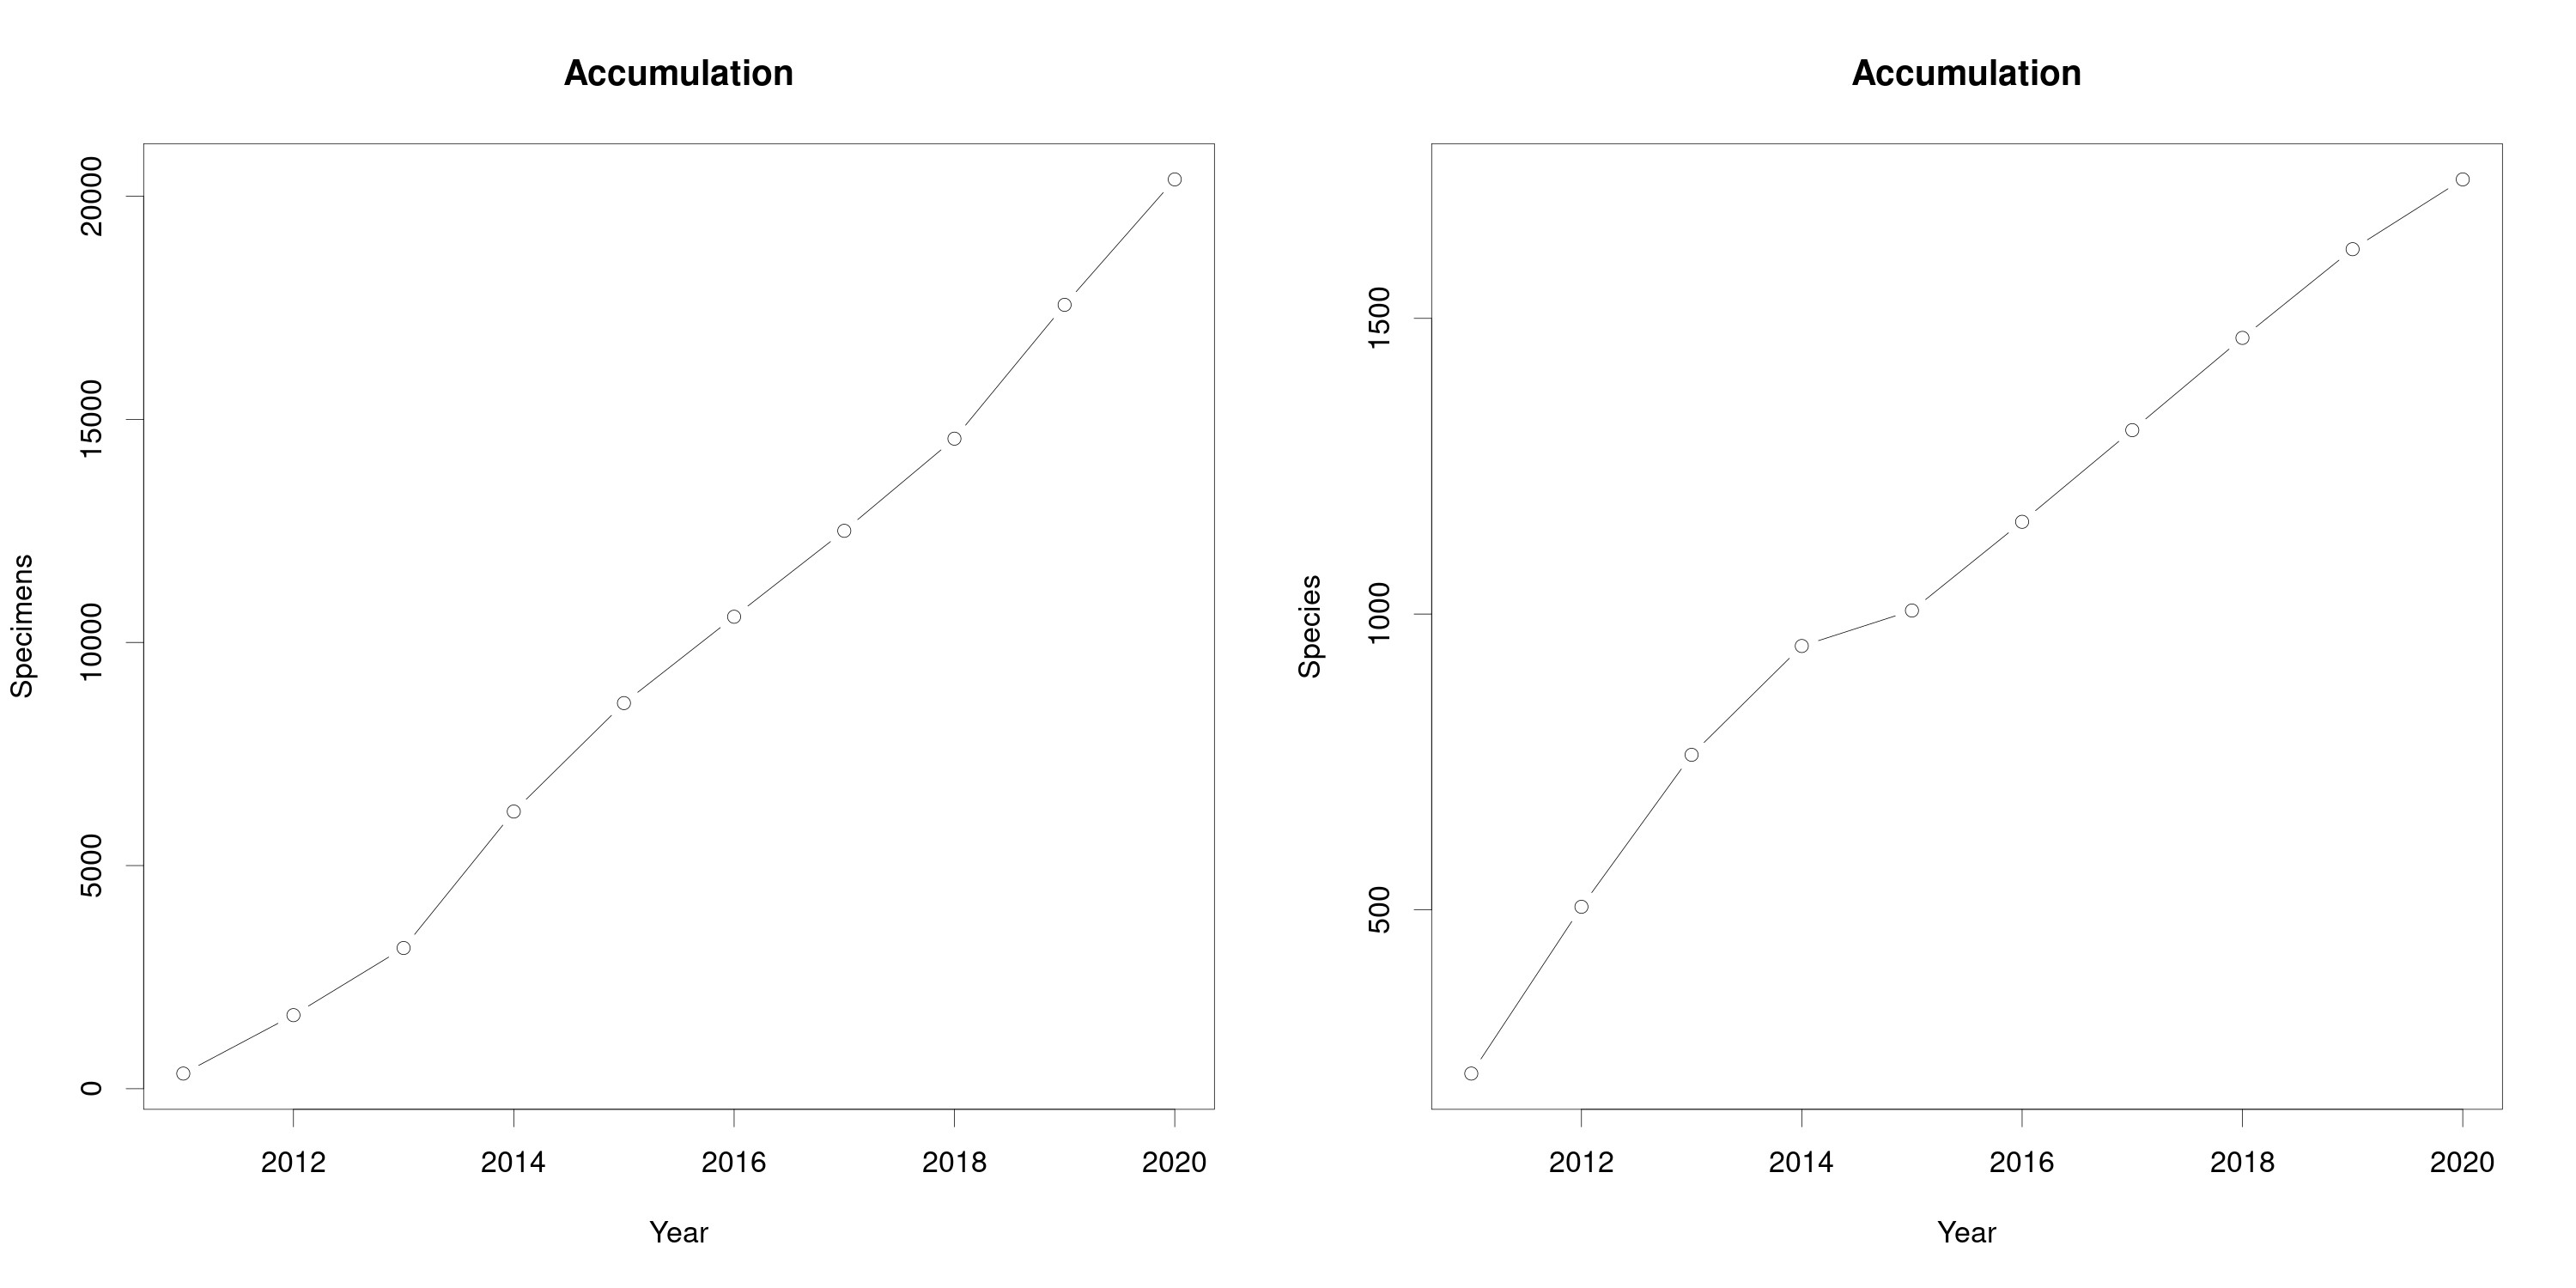
The two plots below show the cumulative number of specimens (left) and species (right) I caught in each of the last 8 years. I caught a constant number of specimens per year: about 1500 until 2013 and about 2000 since 2014. The change in 2014 is most probably due to the fact that I took this website live in winter 2012/2013, what gave my work a boost by the help of others. The cumulative species curve behaves differently: until 2015 it looks like converging to an asymtote (a collectors curve), but from then on it increases linerly. Well, in 2015 I bought a collection permit and started to sample in Weinberg and Westerngrund, and obviously this increased the number of new species I got per year. In both curves we are obviously far away from an asymtote, which needs some discussion concerning the expected maximum number of species in the Region - and worse: these comments don't look like we are dealing with a Laplace-experiment needed for statistics.
|
The upper three plots below show the diversity indices calculated for the measured species abundance vectors of every year. Again we see clear extrema for the year 2015 and especially we see that all three indices are clearly a function of the number of specimens in the sample. To apply them just to the final result of 14574 specimens in 2017 would be clearly misleading. After 2015 the Simpson index seems to converge (with some fantasy) to a value between 0.015 and 0.001, but entropy and evenness both still rise linearly, indicating too that we are far from an asymtote.
The next graph (lower left) shows the y-axis of the species accumulation curve above plotted against the y-axis of the specimen curve, thus showing simply the number of species as function of specimens for every year. So the point slightly to the right of 8000 specimens again belongs to the year 2015. The plot in the middle is the rarefaction curve calculated from the final abundance vector for 2017 and the plot on the right side shows the Chao 1 index, i.e. an estimate of the expected number of species, but once again calculated for the year specific abundance vectors.
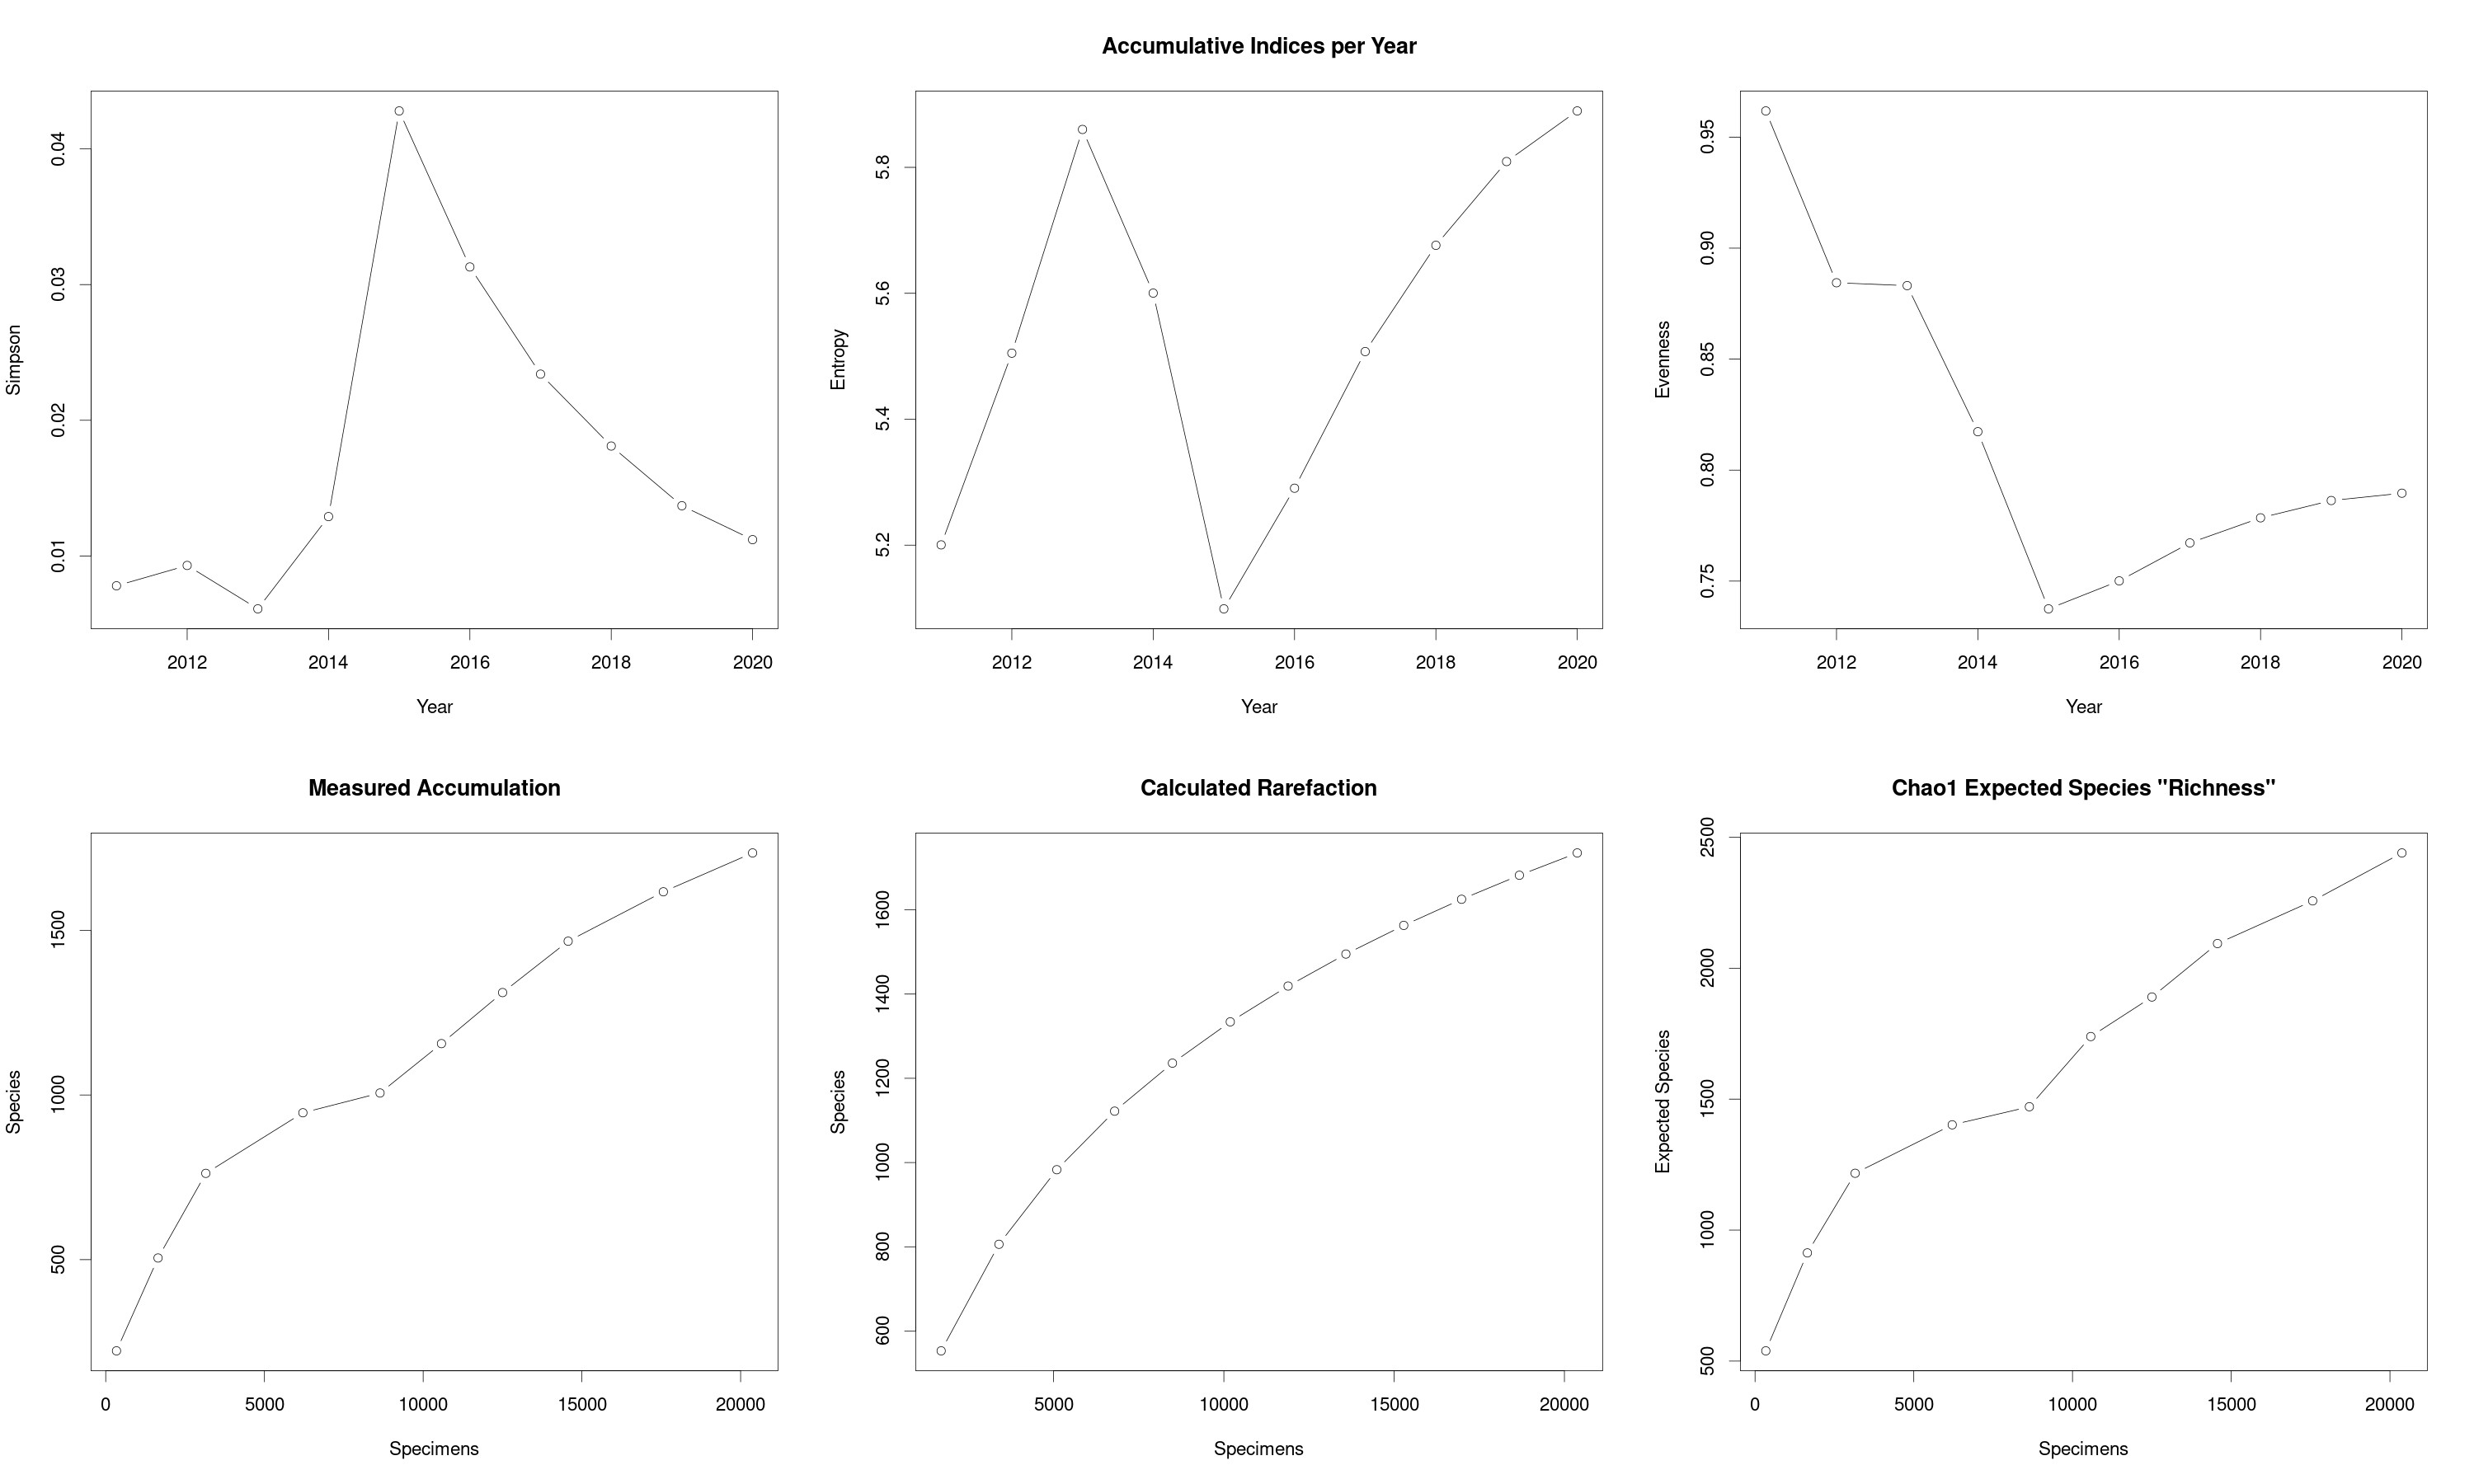 |
So the simple conclusion is that the slight convergence visible in the rarefaction curve calculated from the final result is wrong and so as well the estimated final number of species. What is interesting, is that the estimated number of species runs almost parallel to the mesured number, but - I'm afraid - I don't understand enought yet about the derivation of the Chao1 to comment on this.
The odd result is: if I continue with my current method (net sweeping) I should get 200 additional species every year - and there are already 1645 well documented ones. Let's see what happens, with Malaise traps ...